
 |
Upper Mississippi River Restoration ProgramLong Term Resource Monitoring |
|
| |
||
Land Cover/Use
Data |
||
1989 Land Cover/Land Use
Two data sets were developed from 1989 imagery; a generalized data set using 30-meter/pixel, multi-spectral Landsat Thematic Mapper (TM) satellite images and a genus-based data set developed from 1:15,840-scale color-infrared aerial photography. This photo scale, which covers about four square miles per photo, was chosen as the best compromise between coverage and resolution. |
Thematic Mapper Satellite Imagery
The TM-based data was designed for broad-scale analysis and was completed within a couple of years of acquisition using specialized GIS software. It used a generalized vegetation classification system.
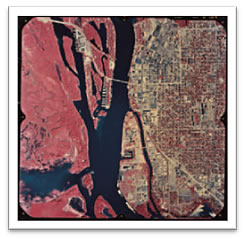
The procedures developed for classifying the 1989 Landsat Thematic Mapper data to map land cover/land use for the Upper Mississippi River System (UMRS) include image mosaicking, projection, atmospheric correction, floodplain extraction, classification, editing, quality assurance, and distribution. The mapping classes include water, aquatic vegetation, grasses/forbs, woody terrestrial, agriculture, urban/developed, and sand.
Acreage summaries are provided for the 35 navigation pools as well as the open river reaches. Classification error was assessed and confidence limits were generated for each of the seven Landsat scenes required to map the UMRS. The database provides resource managers throughout the UMRS with access to site-specific land cover/land use information. In addition, these data were used to verify the adequacy of LTRMP sampling designs and to evaluate the spatial distribution of habitats throughout the system which includes 1,137,035 hectares (2,809,575 acres).
9X9 Color Infrared Aerial Photography
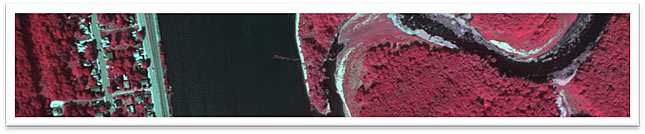
 To develop a data set that would allow for focused analyses at site-specific areas, true color (TC) and color infrared (CIR) aerial photography were collected in the late-summer of 1989 at a scale of 1:15,840. This was a ground-breaking effort to classify almost three million acres of the Upper Mississippi and Illinois River floodplains to the genus-level. The classification system was based on identifiable species, ccurring alone or mixed. To provide additional information, modifiers were added to these map classes that described vegetation density, or relative cover, and, in the cases of trees, a height modifier. Initially, it was unknown whether TC or CIR film would best for vegetation mapping and this is the reason that both formats were collected. Though submersed vegetation could be distinguished slightly better using TC, all other vegetation showed greater distinction using CIR and this was the format used to generate the 1989 LCU dataset.
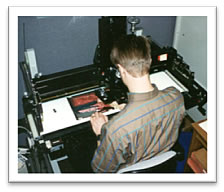
 Film was sliced into individual frames and thin, clear pieces of mylar were taped to each frame. Neat lines were drawn on each mylar overlay to delineate the area being interpreted and then fine-tipped technical ink pens were used to draw vegetation types called polygons. Each polygon received a unique label describing its land cover or land use type and, if necessary, a modifier describing its density and height. Adjacent photos were tied together so the polygons extending beyond the neat lines aligned were carried over to the next overlay.
This information was transferred to 1:24,000-scale USGS topographic base maps and then digitized into a computer. Topo map-based data sets were joined together to create larger navigation pool-based data sets. These final maps were checked for spatial and label errors, then posted to UMESC’s web site for use by LTRMP partners as well as the general public.
More detailed information on this process is available in the PDF located at:http://umesc.usgs.gov/documents/reports/1995/95p00801.pdf
Component specialists: Jennifer Dieck and Andrew Strassman

Page Last Modified: October 17, 2024