Submersed Aquatic Vegetation Modeling Output Online
|
|
Yao Yin1, Jim Rogala1, John Sullivan2, Jason Rohweder1
1 U.S. Geological Survey Upper Midwest Environmental Sciences Center
2 Wisconsin Department of Natural Resources
Introduction
The ability to predict the distribution of submersed aquatic vegetation in the Upper Mississippi River on the basis of physical or chemical variables is useful to resource managers. Wildlife managers have a keen interest in advanced estimates of food quantity such as American wildcelery (Vallisneria americana) population status to give out more informed advisories to hunters before the fall hunting season. Predictions for distribution of submerged aquatic vegetation beds can potentially increase hunter observance of voluntary avoidance zones where foraging birds are left alone to feed undisturbed. In years when submersed aquatic vegetation is predicted to be scarce in important wildlife habitats, managers can get the message out to hunters well before the hunting season (Jim Nissen, Upper Mississippi River National Wildlife and Fish Refuge, La Crosse District Manager, La Crosse, Wisconsin, personal communication).
We developed a statistical model to predict the probability of occurrence of submersed aquatic vegetation in Pool 8 of the Upper Mississippi River on the basis of a few hydrological, physical, and geomorphic variables. Our model takes into consideration flow velocity, wind fetch, bathymetry, growing-season daily water level, and light extinction coefficient in the river (fig. 1) and calculates the probability of submersed aquatic vegetation existence in Pool 8 in individual 5- x 5-m grid cells. The model was calibrated using the data collected in 1998 (516 sites), 1999 (595 sites), and 2000 (649 sites) using a stratified random sampling protocol (Yin and others, 2000b). To validate the model, we chose the data from the Upper Mississippi River Restoration (UMRR) Program Long Term Resource Monitoring (LTRM) element transect sampling in backwater areas (Rogers and Owens 1995; Yin and others, 2000a) and ran the model for each 5- x 5-m grid cell in every growing season from 1991 to 2001. We tallied all the cells and came up with an annual average percent frequency of submersed aquatic vegetation occurrence and compared the results with actual UMRR LTRM survey data (fig. 2). Both a paired Student's test (P = 0.4620) and a Wilcoxon's two-sample test (P = 0.4738) did not contradict our null hypothesis that the model prediction and the sampling data are statistically the same. We have not found an effective statistical test to compare model-predicted spatial pattern with aerial photography geographic information, but we are satisfied with the model's outcome on the basis of visual inspection (fig. 3).
A unique feature about this model is that a prediction can be made by the end of June each year; therefore, providing wildlife managers an assessment of current year vegetation growth condition 3 to 4 months ahead of the arrival of migrating waterfowl that feed on submersed aquatic vegetation. We are working with the UMRR LTRM partnership to create a mechanism so that model predictions (fig. 4) can be updated annually and the results posted on the UMRR LTRM Web site. Our model underestimated the prevalence of vegetation from 2001 to 2004. We speculate that the summer water level reduction conducted in 2001 and 2002 triggered vegetation responses that are outside the model's domain. Future enhancement of the model will incorporate the summer water level drawdown effects as well as the effects of growth conditions in previous years.
Rogers, S J., and Owens, T.W., 1995, Long Term Resource Monitoring Program procedures: Vegetation monitoring: National Biological Service, Environmental Management Technical Center, Onalaska, Wisconsin, July 1995, LTRMP 95-P002-3, 10 p., Appendixes A-E
Yin, Y., Langrehr, H., Nelson, J., Blackburn, T., Cook, T., and Winkelman, J., 2000a, 1998 annual status report: Status and trend of submersed and floating-leaved aquatic vegetation in thirty-two backwaters in Pools 4, 8, 13, and 26 and La Grange Pool of the Upper Mississippi River System: U.S. Geological Survey Upper Midwest Environmental Science Center, La Crosse, Wisconsin, June 2000, LTRMP 2000-P002, 19 p., Appendixes A-B, (NTIS #PB2000-107875).
Yin. Y., Winkelman, J.S., and Langrehr H.A., 2000b, Long Term Resource Monitoring Program procedures: Aquatic vegetation monitoring: U.S.Geological Survey Upper Midwest Environmental Sciences Center, La Crosse, Wisconsin, April 2000, LTRMP 95-P002-7, 8 p., Appendixes A-C.
Figure 1. A conceptual expression of the submersed aquatic vegetation model.
Figure 2. Surveyed and predicted percent frequency of occurrence of submersed aquatic vegetation distribution in the transect sampling backwaters of Pool 8 of the Upper Mississippi River. Survey data were collected using a transect protocol (Yin et al. 2000b). Original data reported percent frequency on the basis of individual backwaters. The survey data used in the figure are the pooled means of all the backwaters on the basis of their respective acreages.
Figure 3. Surveyed (left) and predicted (right) distributions of submersed aquatic vegetation distribution in Pool 8 of the Upper Mississippi River in 1989. The survey data were from the land cover/land use geographic information created by the U.S. Geological Survey Upper Midwest Environmental Sciences Center on the basis of interpretation of aerial photography of 1989.
Figure 4. Annual updates of predicted and surveyed status of submersed aquatic vegetation of percent frequency of submersed aquatic vegetation in Pool 8 of the Upper Mississippi River.
ArcGIS Online Model Prediction Display
We established a web link to an Environmental Systems Research Institute (ESRI) ArcGIS Online website created at the Upper Midwest Environmental Sciences Center umesc.usgs.gov/management/dss/sub_veg_model/sav_model_p8.html to make our model predictions available online. In the current application the user is given the ability to interactively view several annual iterations of the model based upon different types of submersed aquatic vegetation. Submersed aquatic vegetation model predictions can be compared to UMRR LTRM GIS shapefiles depicting land cover/land use interpreted from aerial photography (fig. 5). In addition to the submersed aquatic vegetation model predictions and land cover/land use shapefiles, several years of UMRR LTRM scanned true-color aerial photography was also added.
The user has the ability to view the spatial data, identify features, and measure linear distances (fig. 5). The model predictions of previous years are intended to allow users to review past track records and therefore assess the reliability of the new prediction.
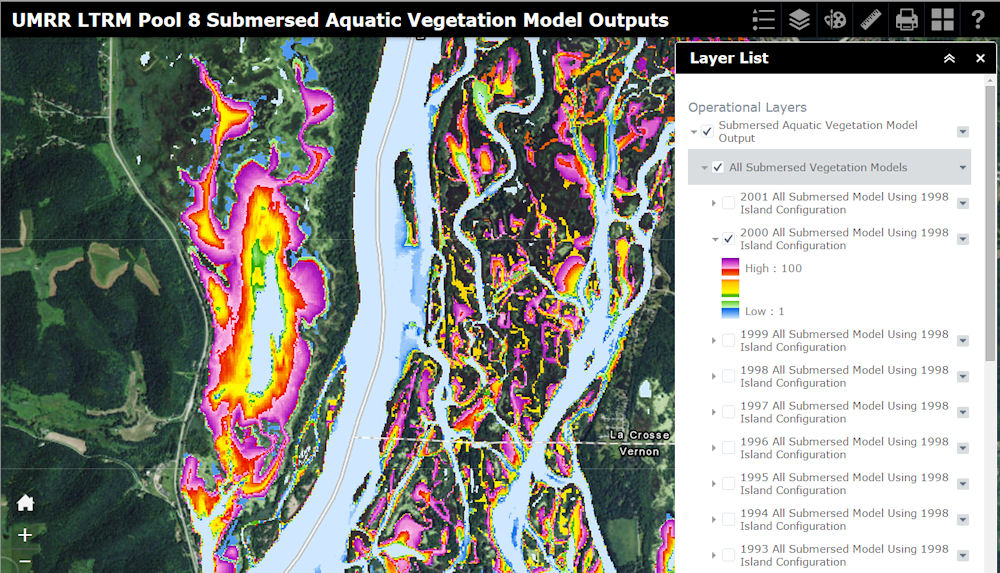

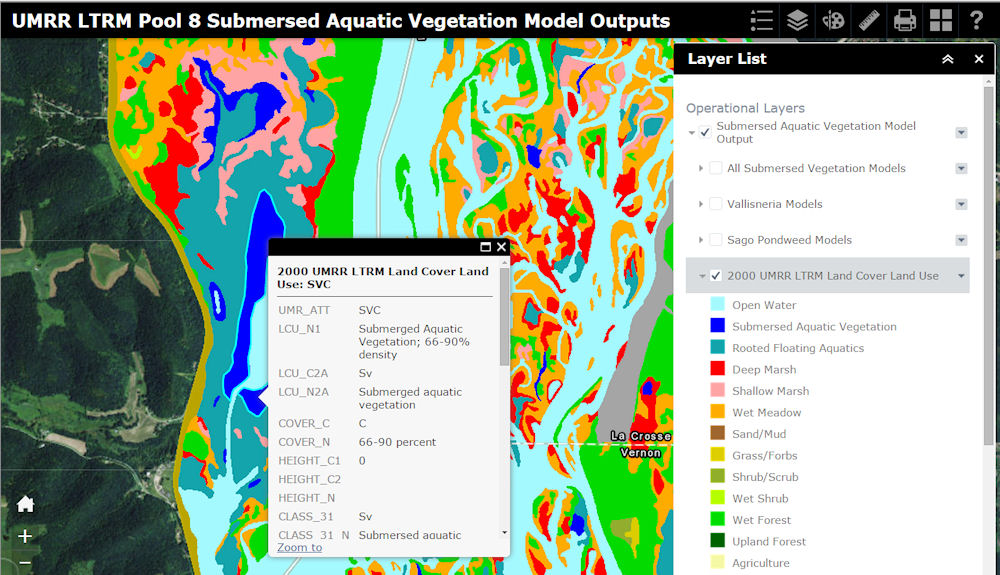
Figure 5. ArcGIS Online website depicting submersed aquatic vegetation from the "2000 - All Submergent Vegetation" and "2000 UMRR LTRM Land Cover/Land Use".
Impact of UMESC Science
The ability to predict the distribution of submersed aquatic vegetation in the Upper Mississippi River on the basis of physical or chemical variables is useful to resource managers. This gives them the ability to manage the river according to expected vegetation. By giving researchers and resource managers on the river access to these model outputs via a stand-alone ArcGIS server website, that information is easily accessible.
Contact
Dr. Yao Yin
USGS Upper Midwest Environmental Science Center
2630 Fanta Reed Road
La Crosse, Wisconsin 54602
Phone: 608-783-6451
Email: yyin@usgs.gov
Principal Investigators
Yao Yin, James Rogala, John Sullivan, and Jason Rohweder
|