| What does bathymetry mean? |
Bathymetry is the measurement of water depth at
various places in a body of water. In addition, the term also refers
to the information derived from such measurements.
|
| Why is bathymetric research important for the
Upper Mississippi River System? |
Bathymetric data is an essential tool scientists
use to monitor the ecology of the river, and to assess the possible
impact of hydrodynamic changes upon the riverine ecology. Bathymetry
was identified as an important data need during the development of
the Long Term Resource
Management program and continues to be ranked high in data needs
assessments among river managers.
|
| How are bathymetric maps generated? |
| Details of the methodology
are included in this web site. |
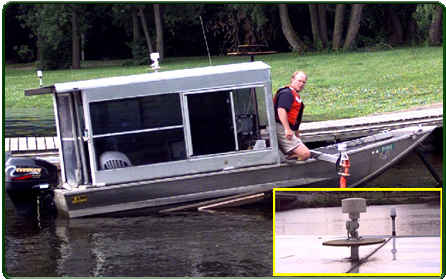 |
At left is the boat currently used to survey
the river and capture the bathymetric data. The inset outlined
in yellow is the Global Positioning System receiver. Its locoation
on the boat can be seen on top of the craft's cabin. |
| In general, water depth measurements are collected using an
echo sounder. At the same time, geographical positions are collected
with a Global Positioning System. These data are collected as
computer files onboard the survey vessel and brought back to
the office. "Maps" are generated through interpolation at geographical
locations between the locations of measured depths. |
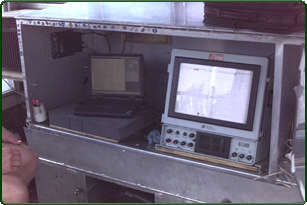
The echo sounder is on the right side of the above photo;
the transducer is located underneath the hull of the craft.
The data generated by the device is digitized and captured
by a laptop computer visible to the left of the sounder. This
equipment is housed inside the cabin of the boat. |
|
| How was bathymetric data generated prior to
these current technologies? |
Although echo sounders for rapid collection of depths have been
around for a long time, the integration with automated positioning
systems in a computer hardware/software setup has only recently become
commonly used. Prior to echo sounders, water depths were measured
and recorded using a "sounding pole". Prior to Global Positioning
Systems, multiple range distance measuring devices or traditional
survey traverses were used to determine geographical location. The
generation of maps through computer interpolation between data points
has nearly replaced "human interpolation" accomplished through plotting
point data and drawing contours.
|
| What different types of
maps can be generated? |
| In the past, the most common type of map was
a contour map, with the contour lines representing selected
water depths located across the map. As computer use of these
data evolved, the "line" data become less important. |
"Areas" of selected depth ranges were needed
to assess the structure of a body of water, particularly when
using a GIS. These types of maps are often displayed as color-coded
maps. A very detailed map could be created with small depth
range intervals. |
However, the 2-dimensional maps using
colors to display depth are not a natural-looking representation
of bathymetry. To get a more eye-pleasing map, 3-dimensional
maps can be created. |
 |
 |
 |
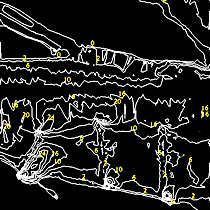
| This contour map exhibits
a portion of Mississippi River Pool 13. The contours on the
bottom half of the map reflect the prominent wingdam features
of this portion of the pool. |
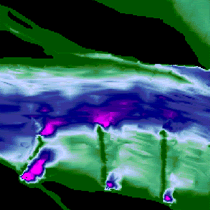
This 2-D color-coded map
shows the same features within Pool 13 as the previous map.
The bright spots on the bottom are areas scoured by the currents
generated by wingdams. |
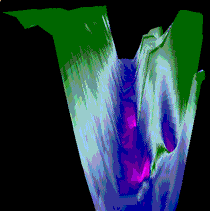
This 3-D color-coded map again reflects
the same features of Pool 13 as the previous maps - this perspective
provides a view looking down the channel of the river. |
| These same features of Pool 13 are
transformed from initial survey data into a bathymetric map
in the Methods - Interpolation
section of this web site. |
|
| How accurate are the maps? |
The water depth collected in the field has an accuracy of about
0.15 meters. However, because the maps are generated by interpolation
between data points, the estimated water depths in most locations
of the map are much less accurate. In some cases, the water depths
between transects used for data collection may be much different than
along the transects. For this reason, and for the reasons discussed
below, these maps should not be used for all navigational purposes.
|
| Is bathymetric research important for commercial
and recreational navigation? |
The information displayed by the LTRMP bathymetric maps is a general
representation of the bathymetry at one point in time. More accurate
maps are required to determine if the main channel is suitable for
barge passage, and these specific data are collected regularly by
the U.S. Army Corps of Engineers at selected navigation channel locations.
The LTRMP maps are useful to recreational users for general navigation,
but due to frequent changes in the river bottom, water levels, and
location of submerged snags, the maps should not solely be relied
on for safe navigation.
|


