

Upper Midwest Environmental Sciences Center
U.S. Fish & Wildlife Service - Automated Waterfowl Counts
The Upper Mississippi River System (UMRS) is an important stopover point for waterfowl during early-spring and late-fall migrations, particularly portions of the river between the Navigation Pools 4 and 13.This part of the Upper Mississippi River contains large areas of aquatic vegetation that include preferred food sources such as Arrowhead and Wild Celery. In addition, many of these areas are closed to hunting and posted as voluntary avoidance zones, allowing waterfowl to feed and rest undisturbed before continuing their journey.
The Fish and Wildlife Service has been conducting aerial surveys of these areas to document approximate numbers and primary usage locations for many years.As usage patterns change, the closed area boundaries are modified as well. In 2003, a multi-year project began that would test the viability of using digital aerial photography to count waterfowl and help determine preferred feeding habitat. Initially, a 14-megapixel digital single lens reflex camera (the Kodak DCS Pro 14n) was used for this study, followed by the 16-megapixel Canon 1DS Mark II in 2005, then by the 39-megapixel ApplanixDSS 439 in 2009.
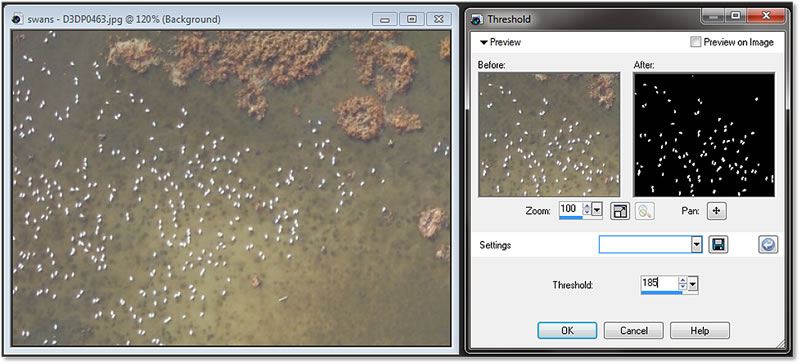
Once images are georeferenced and mosaicked into single images of study sites, image processing software is used to perform a threshold adjustment on the image.This threshold adjustment takes each pixel value and recolors it either black or white, depending on the value selected. As in the example shown below, a threshold of 185 will turn all pixel values of 185 or less to white and pixels greater than 185 to black. A threshold setting is chosen that emphasizes waterfowl, turning waterfowl pixels white and allowing other parts of the image to turn black. This image is saved as a 1-bit black-and-white image. Some editing of other light areas may be necessary to ensure that only waterfowl are being assessed.
Object-based feature recognition software, such as the ArcMap extension Feature Analyst, can manipulate these images further and be programmed to place a single point in the center of each block of white pixels. These points are edited once more to ensure that only waterfowl are represented, resulting in a layer of points documenting each waterfowl’s location on the earth at the time the image was taken. The points can also overlay images from earlier dates as well as additional GIS layers such as water depth, flow velocities, or vegetation to develop a better understanding of the needs of migrating waterfowl. Examples of this process are shown in the images below, including an animation of swan use for a study site in lower Pool 8 during the fall 2004 migration.
|
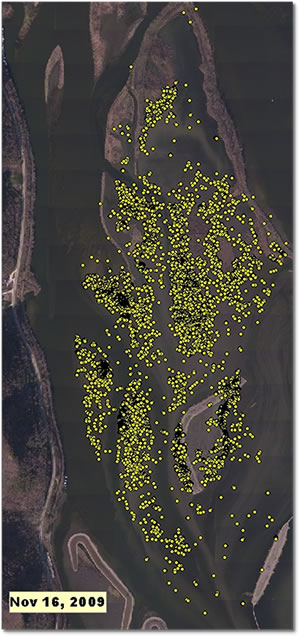
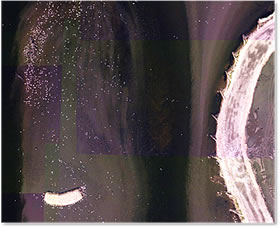 Aerial photo of feeding swans from Nov. 16, 2009. |
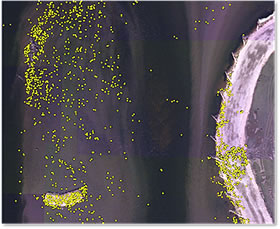 Points generated from 1-bit aerial photo. |
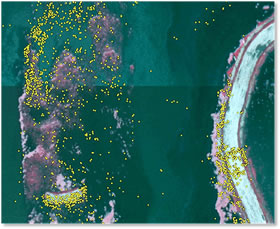 Swan points on aerial photo from Aug 17, 2010. |
 |
 |
|
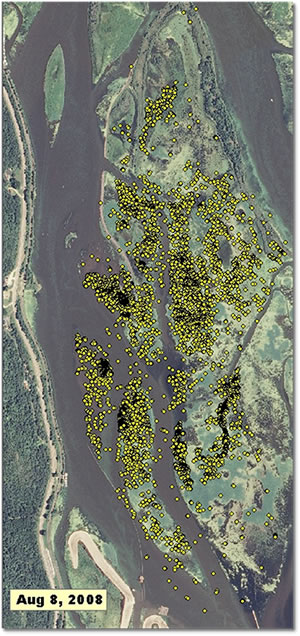
| An overview of the same study area on lower Pool 8 near Brownsville, MN shows that 8,813 swans were present on November 16, 2009. A true color image from August 2008 shows preferred resting and feeding areas. | ||
 |
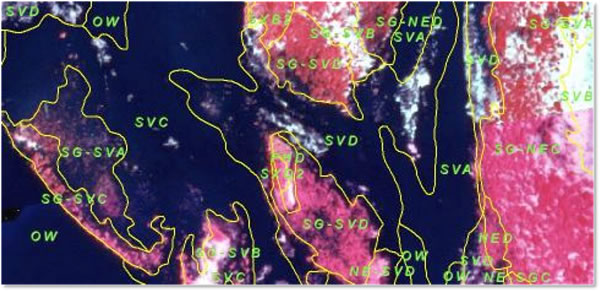 |
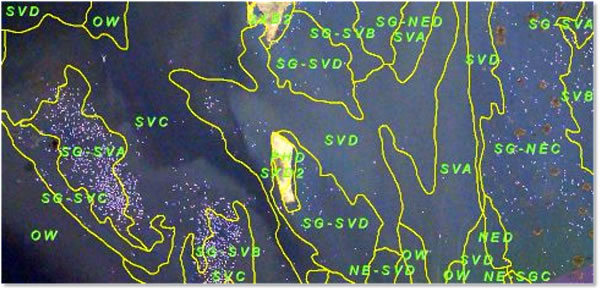
| The image at the top is a aerial photo mosaic of swans from November 10, 2003 is overlaid with vegetation info from the summer of the same year (shown just below) to provide detailed information on preferred feeding habitat. SG = Sagittaria, also known a Broadleaf Arrowhead, and its tuber is a preferred food source of tundra swans. For more info on these vegetation codes, please see this guide (370 KB .jpg). |
 Swan counts over a 5-week period in the fall of 2004. |
Related studies are currently in progress to assess digital imagery’s ability to distinguish between different waterfowl species when collected at very high resolutions (between 1” and 4”/pixel).
Impact of UMESC Science
Determination of preferred habitat locations and intensity of use allows resource managers to better understand the needs of migrating waterfowl.
Points of contact: Jennifer Dieck and Larry Robinson
Mention of trade names or commercial products does not constitute endorsement or recommendation for use by the U.S. Department of Interior, U.S. Geological Survey.
URL: http://umesc.usgs.gov/mapping/usfws_waterfowl_counts.html
Page Contact Information: Contacting the Upper Midwest Environmental Sciences Center
Page Last Modified: February 23, 2012