Below are detailed plots describing relations between species detectability, occurrence, subpopulation colonization, and subpopulation extinction.
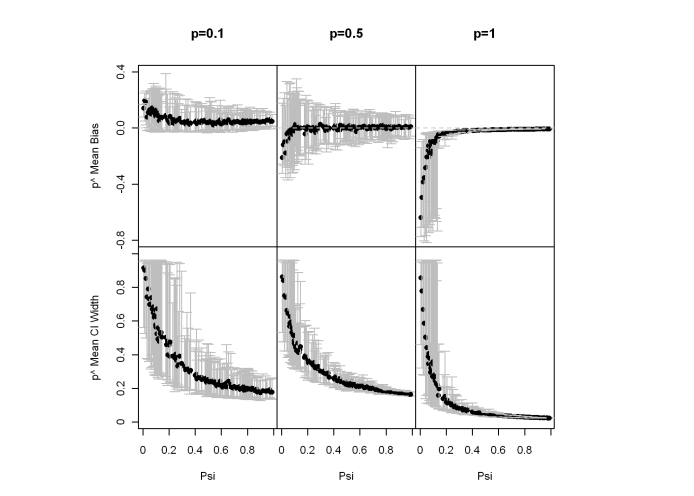
Fig.1: Upper panel: Distribution of the mean bias in p^ for differing levels of p given ψ. Each arrow bar is a 95% confidence interval on the mean bias for p^ (minimum sample size per bar=50), with the black dot representing the grand mean.
Lower panel: Distribution of the p^ mean 95% credible interval widths for differing levels of p given ψ. Each arrow bar is a 95% confidence interval on the mean 95% credible interval widths, with the black dot representing the grand mean.
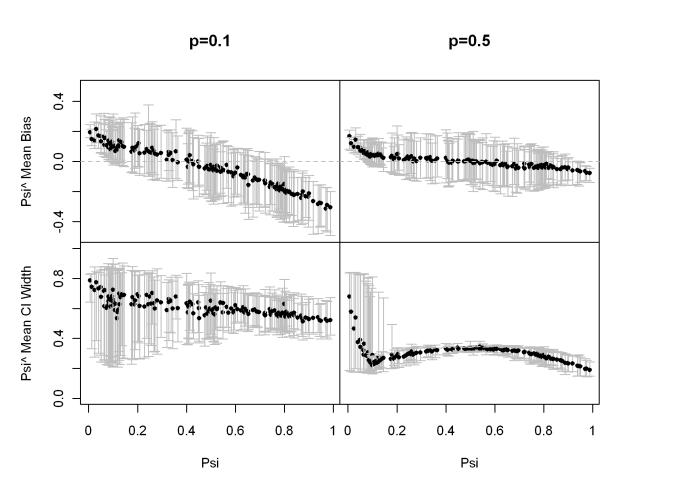
Fig.2: Upper panel: Distribution of the mean bias in ψ^ for differing levels of p given ψ. Each arrow bar is a 95% confidence interval on the mean bias for ψ^ (minimum sample size per bar=50), with the black dot representing the grand mean.
Lower panel: Distribution of the ψ^ mean 95% credible interval widths for differing levels of p given ψ. Each arrow bar is a 95% confidence interval on the mean 95% credible interval widths, with the black dot representing the grand mean.
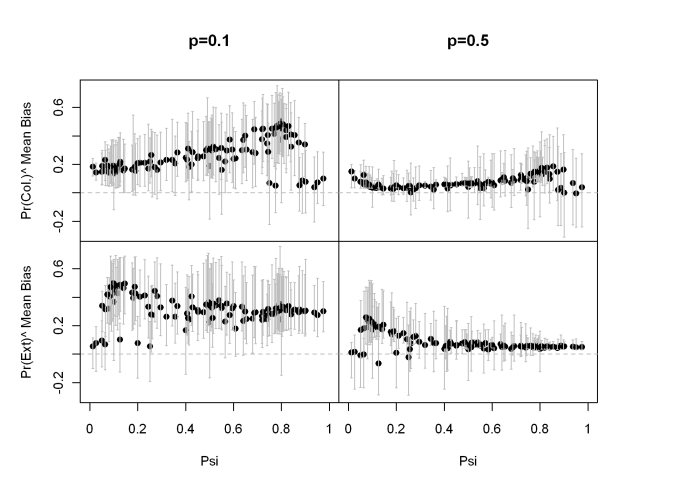
Fig.3: Upper panel: Distribution of the mean bias in γ^ for differing levels of p given ψ. Each arrow bar is a 95% confidence interval on the mean bias for γ^ (minimum sample size per bar=50), with the black dot representing the grand mean.
Lower panel: Distribution of the mean bias in (1-φ)^ for differing levels of p given ψ. Each arrow bar is a 95% confidence interval on the mean bias for (1-φ)^ (minimum sample size per bar=50), with the black dot representing the grand mean.
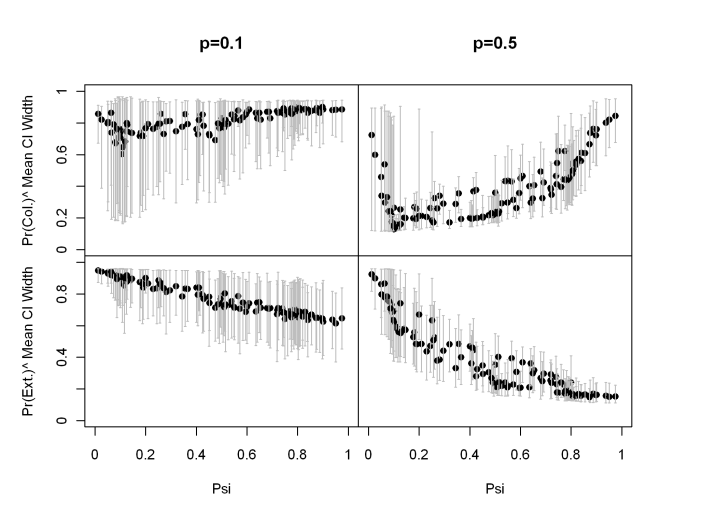
Fig.4 Upper panel: Distribution of the γ^ mean 95% credible interval widths for differing levels of p given ψ. Each arrow bar is a 95% confidence interval on the mean 95% credible interval widths, with the black dot representing the grand mean.
Lower panel: Distribution of the (1-φ)^ mean 95% credible interval widths for differing levels of p given ψ. Each arrow bar is a 95% confidence interval on the mean 95% credible interval widths, with the black dot representing the grand mean.
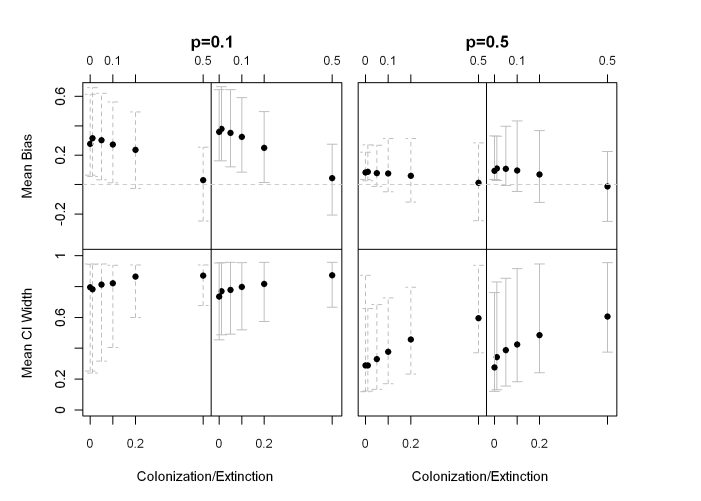
Fig.5: Upper panel: Distribution of the mean bias in γ^ and (1-φ)^ for differing levels of p given γ and (1-φ). Each arrow bar is a 95% confidence interval on the mean bias for γ^ and (1-φ)^ (minimum sample size per bar=50), with the black dot representing the grand mean.
Lower panel: Distribution of the γ^ and (1-φ)^ credible interval widths for differing levels of p given γ and (1-φ), with the black dot representing the mean 95% credible interval width across the repetitions. |


