
|
Background
The TWGCRN is a growing network of U.S. and Canadian organizations, scientists, and research sites created to provide rigorous scientific information on the 1) long-term impacts of climate/global change on terrestrial wetlands and associated uplands (wetland-upland landscape matrices) of North America and 2) options that resource managers have to mitigate negative impacts. This effort is part of the U.S. Geological Survey’s (USGS) Amphibian Research and Monitoring Initiative (ARMI) and supports the goals and objectives of ARMI, the USGS science strategy, and of partner organizations.
We began developing the framework and collaborations for this effort in 2004, in response to related needs for information on how global change was driving recent amphibian declines and on the impacts of observed and predicted climate change on vital wetland-upland landscape matrices in the United States and Canada. These matrices not only support amphibians and other unique biodiversity, but provide a range of additional ecosystem services centrally important to humans. Wetland components of these matrices continue to be drained and degraded globally. We designed the TWGCRN especially, but not exclusively, to assess how hydrologic and biological elements of wetland-upland landscape matrices respond to changes in climate and human activities along environmental gradients in North America. Our reasons for focusing on these relationships are straightforward:
- temperature, water quantity, and water quality are powerful drivers of ecological processes and patterns across landscapes and, thus,
- interactions of climate, human activity, and hydrology greatly determine the values of essential ecosystem services on these landscapes in fundamental ways.
Implementation
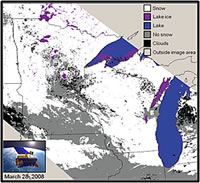
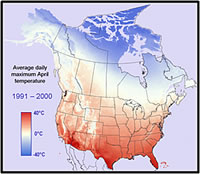
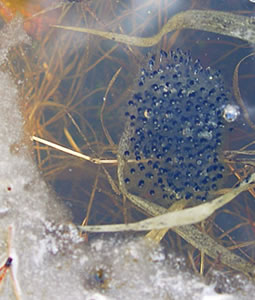
We established the first TWGCRN research nodes in 2008 (Fig. 1) along known (Fig. 2) and projected (Fig. 3) climate, land cover (Fig. 4), human-impact (Fig. 5), and ecological gradients (Fig. 6) in the United States and Canada and continue to develop the partnerships and collaborations necessary to add research nodes each year. We described the initial boundary of the TWGCRN by the range of the wood frog (Rana sylvatica), plus the remainder of the Prairie Pothole Region not within this boundary (Fig. 1). This portion of the continent contains key gradients of climate, elevation, land cover/use, human activity, carbon storage, biodiversity, and a high percentage of the wetlands in North America, all very important to consider in terms of the impacts of climate change. Furthermore, wood frogs are potentially sensitive indicators of climate and global change in aquatic and terrestrial habitats because they typically breed explosively and communally in temporary wetlands very early in the spring, but then disperse into nearby terrestrial habitats the rest of the year. Also, the wood frog is the only amphibian species that has adapted to the cold, high-latitude portions of Canada and Alaska, areas of dramatic recent effects due to climate change. More recently, we have begun to expand the TWGCRN beyond the range of the wood frog because our overall approach is applicable to wetland-upland landscape matrices practically anywhere and environmental gradients in North America extend across the continent.
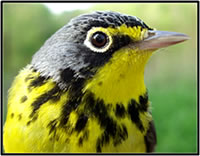
Monitoring the statuses of amphibian and bird populations relative to other environmental variables across spatiotemporal scales is central to our approach. Amphibian and bird populations are well-suited for this purpose because their statuses represent the integrated effects of global change in wetland and terrestrial habitats. Most amphibian species in North America breed in wetlands, but spend a substantial portion, if not the majority, of their lives on the upland portion of the wetland-upland landscape matrix. Many bird species live in close association with wetlands or within a mixture of wetland and upland habitats, not only during the breeding season but while migrating or overwintering in different geographic regions. Thus, changes in the statuses of amphibian and bird populations can reflect effects of global change on biodiversity and productivity components of ecosystem services directly and other components indirectly. Such populations also are tractable scientifically, especially amphibians. We can sample and monitor them in ways that allow us to describe if population changes are associated with global-change factors and we can manipulate individuals experimentally to better understand how specific factors can affect fitness.
Integrated Approach
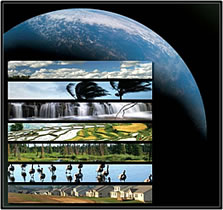
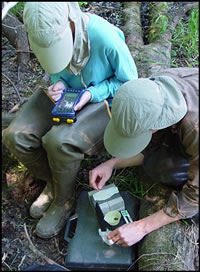
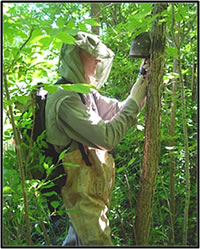
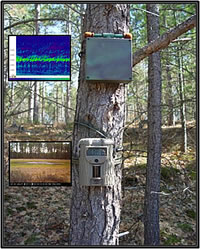
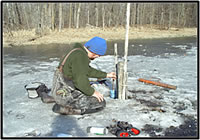
Our overall approach is integrated across scales, methods, and research effort (Fig. 7). Our results are comparable across the network because we use standardized protocols. At a minimum at all TWGCRN research nodes, we use ground-based recorders to monitor sounds amphibians, birds, humans, and other sources make at individual wetlands (extensive study sites). We measure additional variables at sites studied more intensively from the ground, including water level, air and water temperature, precipitation, water quality, the presence of pathogens, and vegetation structure to varying extents.
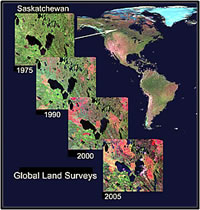
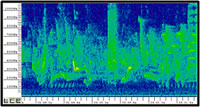
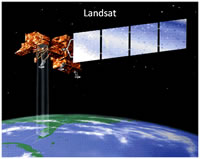
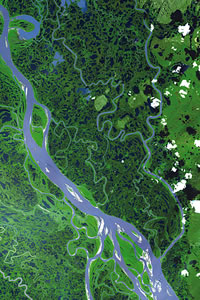
 While collecting data from the ground, we also are using data collected via an array of satellite sensors to assess landscape conditions, such as snow and ice cover, characteristics of vegetation green-up, primary productivity, the degree of dryness and standing water, land cover, and effective habitat connectivity, either within 2500-km2 blocks centered on network nodes or across the entire breadth of the network for some variables. Comparing data collected from satellite sensors with data collected from the ground (Fig. 8) at extensively studied sites allows us to describe seasonal biotic and abiotic landscape conditions relative to seasonal calling phenology, occupancy, species diversity, and entire soundscapes at wetlands within (for example, Fig. 9) and across research nodes (for example, Fig. 10). Comparing satellite and ground-collected data at intensively studied sites enables us to provide more details regarding relationships among biotic and abiotic variables across scales, as illustrated in comparisons between the 2008 (relatively wet) and 2009 (drought; Fig. 11) breeding seasons for some of the sites in the St. Croix National Scenic Riverway node (Figs. 12a-d). While collecting data from the ground, we also are using data collected via an array of satellite sensors to assess landscape conditions, such as snow and ice cover, characteristics of vegetation green-up, primary productivity, the degree of dryness and standing water, land cover, and effective habitat connectivity, either within 2500-km2 blocks centered on network nodes or across the entire breadth of the network for some variables. Comparing data collected from satellite sensors with data collected from the ground (Fig. 8) at extensively studied sites allows us to describe seasonal biotic and abiotic landscape conditions relative to seasonal calling phenology, occupancy, species diversity, and entire soundscapes at wetlands within (for example, Fig. 9) and across research nodes (for example, Fig. 10). Comparing satellite and ground-collected data at intensively studied sites enables us to provide more details regarding relationships among biotic and abiotic variables across scales, as illustrated in comparisons between the 2008 (relatively wet) and 2009 (drought; Fig. 11) breeding seasons for some of the sites in the St. Croix National Scenic Riverway node (Figs. 12a-d).
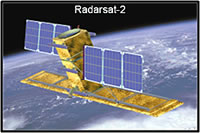
As part of this work, TWGCRN scientists have been testing and applying sophisticated, new tools and integrating them with more established technologies. These tools include applications of data from satellite-borne radar sensors to assess changes in vegetation and surface water (Fig. 13), digital recorders to monitor amphibian and bird calls and other sounds at field sites (Figs. 8, 12d), new software and approaches to analyze recordings (Fig. 12d), and advanced data-integration and visualization techniques (Figs. 12d, 14).
All told, using established and cutting-edge tools will enable us to provide resource managers and other stakeholders much-needed, comparative information on how climate and land use, for example, are associated with the timing of physical and biological events, hydrology, characteristics of biological communities and soundscapes, habitat connectivity, and associated ecosystem services in these landscape matrices and how these relationships could change in the future.
Information for resource managers
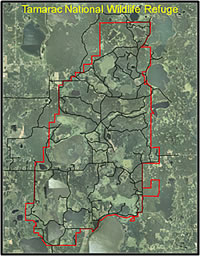
An example of how resource managers could use this information pertains to the Tamarac National Wildlife Refuge, a TWGCRN research node in an area of transitional land cover and varied land use in western Minnesota. We are using water-level loggers to monitor water levels and acoustic recorders to monitor sounds made by calling amphibians, birds, and other sources at wetlands in this refuge. We are working to couple data from these ground-based sensors with data from satellite sensors to describe relationships of hydrologic and biological variables at wetland scales to hydrologic and biological variables across a 2500-km2 block that encompasses the refuge. Further integration of data we are collecting via temperature loggers at wetlands and from nearby weather stations will enable us to provide refuge staff information on changes in amphibian and bird populations relative to climate, land cover, and a set of landscape conditions over time, which they could use to help decide how best to manage interconnected wetland and terrestrial habitat within the refuge. In addition, our assessments of habitat connectivity extending out from the refuge boundaries, considered within a context that includes results from ongoing monitoring and predictive models of future climate conditions, will enable refuge staff to work more effectively with partners to conserve essential habitat linkages that might allow biological communities to persist across the landscape at scales larger than the refuge over time (Fig. 15).
Future Goals
- Continue to add research nodes to the network along North American environmental gradients, including outside the original TWGCRN footprint.
- Execute more of our full suite of measurements and approaches over a larger portion of the network.
- Continue to develop and apply new methods for analyzing, integrating, and describing complex information collected across methods and scales.
- Model potential changes in future conditions based upon historical and current baseline conditions and downscaled climate models.
- Deliver network-wide information to stakeholders who need it.
Contacts
Overall TWGCRN lead scientist:
Walt Sadinski, U.S. Geological Survey
Upper Midwest Environmental Sciences Center
2630 Fanta Reed Road
La Crosse, WI, United States
54603
608-781-6337
wsadinski@usgs.gov
Lead scientist for remote-sensing and geospatial analyses:
Alisa Gallant, U.S. Geological Survey
Earth Resources Observation and Science Center
47914 252nd Street
Sioux Falls, SD, United States
57198-0001
605-594-2696
gallant@usgs.gov
Lead scientist for Radarsat-2 data acquisition and the development of data-processing algorithms:
Brian Brisco, Natural Resources Canada
Canada Centre for Remote Sensing
588 Booth Street, Room 456
Ottawa, Ontario, Canada
K1A 0Y7
613-947-1815
Brian.Brisco@NRCan-RNCan.gc.ca |
|