|
LCU Maps - Background |
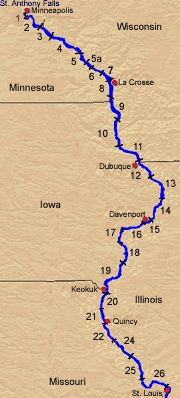
Land cover/use maps are a valuable resource for scientists studying the Upper Mississippi River System. The maps provide important details about the river, and researchers can make comparisons with similar maps of previous years to analyze trends or patterns of change in the river's ecology. |
|
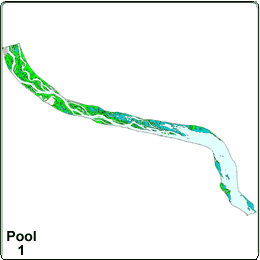
The above illustrations are land cover/use maps of Mississippi River Pool 8 (located near La Crosse, Wisconsin). The 1891 map provides one example of Pool 8 land cover prior to the development of the lock and dam system in the 1930's; the two more recent maps exhibit the significant changes impoundment of the river introduced into the system. The 1975 map reflects what many scientists consider the river's healthiest condition since impoundment. The 1998 map indicates recent changes when compared to the 1975 map, for example a recognizable loss of marsh habitat in the lower pool.
|
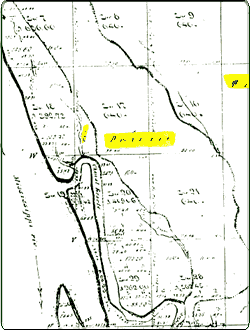 |
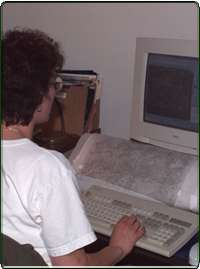
HISTORICAL DATA: UMESC scientists use Geographic Information Systems (GIS) software to develop and analyze the land cover data. The data used to generate the maps come from surveys conducted since 1809, when the Government Land Office began the first public land surveys of the Upper Mississippi River System. The information is manually transferred from the original source and converted to a digital format using a digitizing tablet.

|
|
|
CURRENT TECHNOLOGIES: Improvements in technology now allow for more detailed land cover/use datasets, which, in turn, leads to better and more specific analysis. GIS systems today can analyze complex datasets. Dedicated vegetation specialists take advantage of this capability to generate intricate floodplain vegetation layers using high-resolution color infrared photography.
|
|
|
|
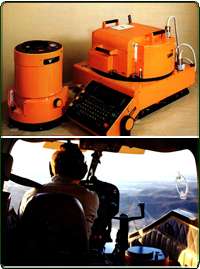
| Color infrared photographs are captured by the Jena LMK 2000 aerial camera. A flight planning software program is used to generate beginning and ending coordinates for each flightline. |
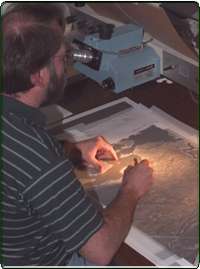
Photo interpreters delineate land cover/use information on 1:15,000-scale color infrared photographs. Vegetation information on the photos are scaled and transferred to mylar overlays registered to digital orthophoto quarter-quads (DOQQs). This step references the data to the earth’s surface. |
The data are scanned with a large format drum scanner into a TIFF image with a resolution of 300 dots per inch. Editing software is used to reference the image to the earth’s surface, convert it from a raster format to a vector format, and to add attribute information to the automated data. The final product is then ready for analysis with a GIS. |
|


