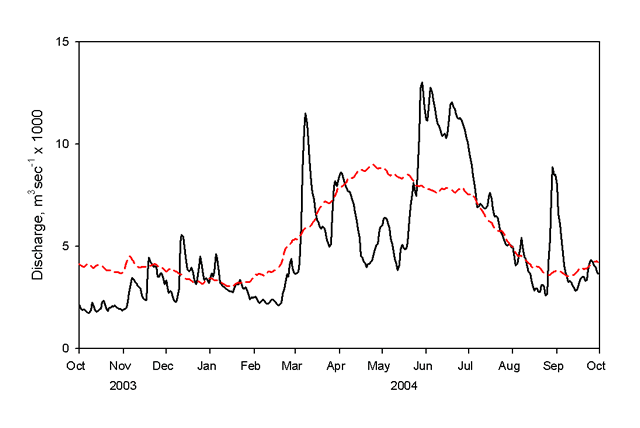
| Figure 2. | Mean discharge (m3sec-1 x 1,000) for the period of record (dashed line) at St. Louis, Missouri, and discharge for the 2004 water year (solid line). |
 |
|
Page Last Modified: April 17, 2018
| Figure 2. | Mean discharge (m3sec-1 x 1,000) for the period of record (dashed line) at St. Louis, Missouri, and discharge for the 2004 water year (solid line). |
 |
|