
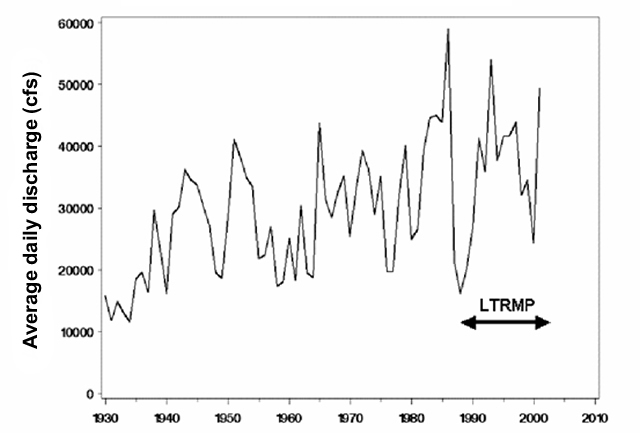
| Figure 14. | Annual means of the average daily discharge (cfs) from 1930 to 2001 show that the Long Term Resource Monitoring Program (LTRMP) has monitored one long-term flow cycle (about 11 years). The pronounced long-term increase in discharge in the Upper Mississippi River System over the last 70 years suggests that a measure of long-term "baseline" conditions is difficult. The influence of the near-record flood in spring 2001 is evident and may signal the start of another next high-flow period. |
 |
|
Page Last Modified: April 17, 2018