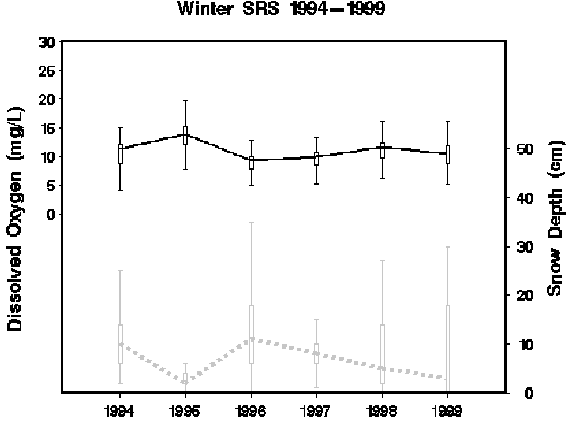
| Figure 5. | Winter dissolved oxygen concentration (solid black line, left axis) and snow cover (dashed grey line, right axis) in Pools 4, 8, and 13 combined for winter stratified random sampling episodes, 1994–1999. Points show the mean, ± 1 standard deviation, and the range. The data show an inverse relation between snow depth and dissolved oxygen concentration. |

Page Last Modified: April 17, 2018

