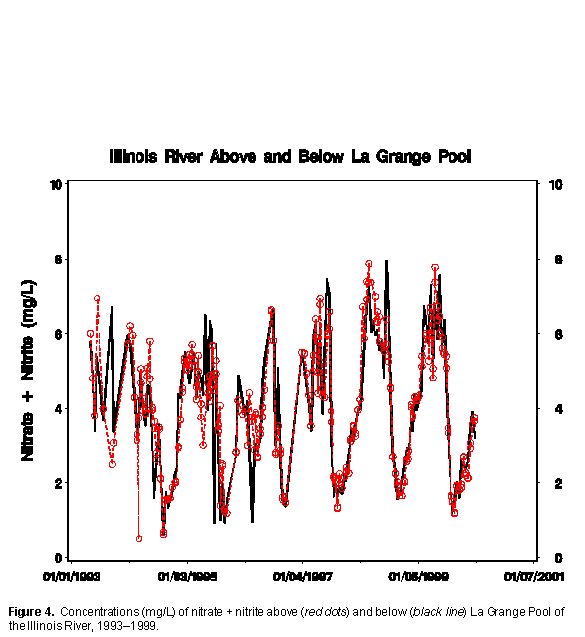
| Figure 4. | Concentrations (mg/L) of nitrate + nitrite above (red dots) and below (black line) La Grange Pool of the Illinois River, 1993–1999. |

Page Last Modified: April 17, 2018
| Figure 4. | Concentrations (mg/L) of nitrate + nitrite above (red dots) and below (black line) La Grange Pool of the Illinois River, 1993–1999. |
