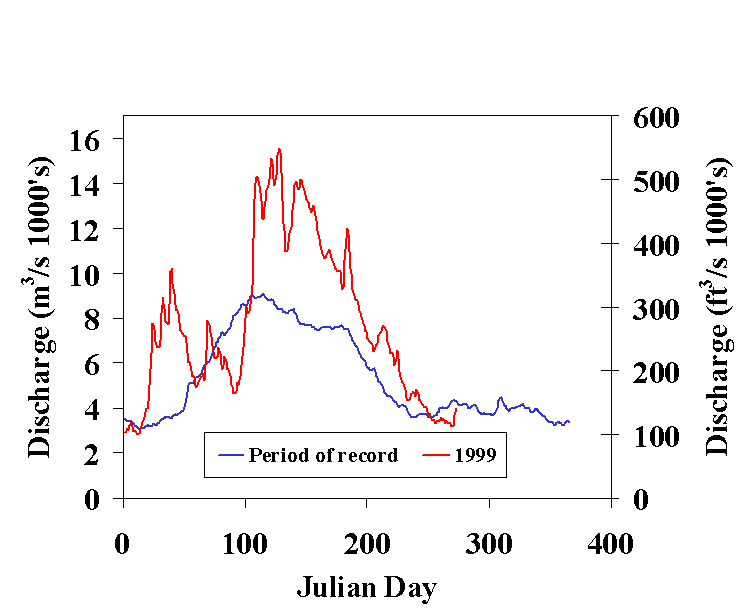
| Figure 2. | Average daily discharge of the Mississippi River at St. Louis, Missouri, for the 67-year period of record (blue line) and for the first 9 months of 1999 (red line). |

Page Last Modified: April 17, 2018
| Figure 2. | Average daily discharge of the Mississippi River at St. Louis, Missouri, for the 67-year period of record (blue line) and for the first 9 months of 1999 (red line). |
