|
Disclaimer: This information is provided to help better inform ongoing LTRM partner discussions. The power plots are generated from small sample sizes; all plots should be treated as approximate. Contact: Questions or comments may be directed
to Brian Gray, LTRM statistician, Upper Midwest Environmental
Sciences Center, La Crosse, Wisconsin,
at brgray@usgs.gov. |
Page Last Modified: April 17, 2018


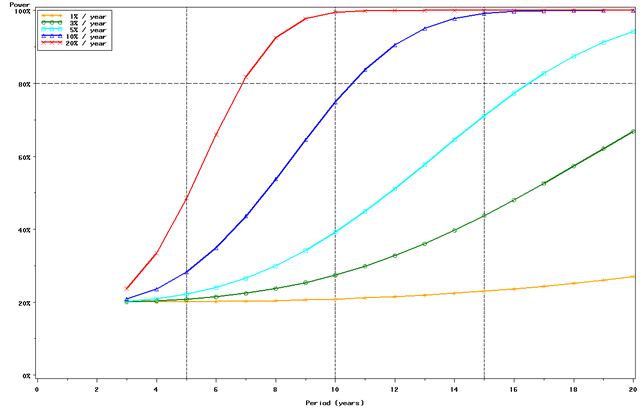
 Figure 2a: Estimated power to detect temporal trends in mayfly (Ephemeridae) relative abundance under the present sampling intensity in Pool 4. Trends assumed exponential.