
Upper Mississippi River Restoration Program
Long Term Resource Monitoring

|
Upper Mississippi River Restoration ProgramLong Term Resource Monitoring |
|
| |
||
There are ongoing needs for analytical tools to investigate the cumulative effects of fluctuating water flow and depth. The Connectivity and Inundation Tool was developed at UMESC to help address these needs. The tool allows for the investigation of the historic hydrographs or proposed theoretical hydrographs. It does this by utilizing existing 2D hydrodynamic models that have been encapsulated via spatially explicit regression analysis and a database containing a timeline of explanatory values (e.g., river stages). The Connectivity and Inundation Tool is a dynamic tool, allowing for the importation of user supplied models/hydrographs. This design aspect increases the life span, relevancy, and portability of the application.
The tool currently comes loaded with models of UMR Navigation Pool 8 bathymetry, flow velocity, shear stress, and systemic connectivity as a function of the discharge rate measured at the upstream lock and dam. The tool outputs summary surfaces of mean, minimum, maximum, and variance of the selected hydrological characteristic, over variable date range. It allows the user to specify threshold values (e.g., water depth > X) and output maps of the number of events that meet these conditions. Connectivity and Inundation Tool is also capable of generating maps of event duration and event Julian start date (Figure 1). The models that are currently loaded in the tool offer a date range of 1975-2013.
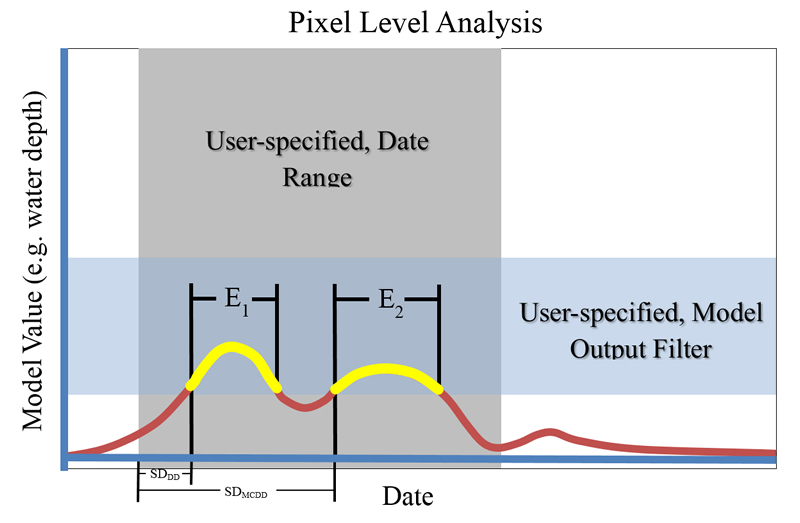
Figure 1. Chart of model response over time measured at a single pixel. This chart shows the user specified date range, model output filter, events (E1 and E2), the time span for start date for duration days (SDDD), and the time span for start date for maximum consecutive duration days (SDMCDD).
Flood inundation and hydrological connectivity are main drivers of the structure and function of river-floodplain ecosystems. Recent studies conducted on the Upper Mississippi River indicate that distributions of limiting nutrients (nitrogen and phosphorous), submersed aquatic vegetation, fish communities, and native mussels are strongly influenced by hydrological connectivity, water flow velocity, sheer stress, and other aspects of local hydrological regimes. Likewise, distributions of floodplain vegetation and soils, and rates and trajectories of forest succession and nutrient turnover are strongly influenced by spatial and temporal variation in river-floodplain connectivity and flood inundation duration. Such distributions can change over multiple temporal scales as a result of daily, monthly, and annual changes in river discharge and how discharge modifies the distribution and movement of water within river-floodplain environments.
There is strong interest among ecologists and river managers in developing and using hydrodynamic and flood inundation models to better understand and forecast effects of hydrological changes or geomorphic modifications to various ecological components of riverine landscapes. Such modeling efforts often result in maps of the distribution of water and water movement at a given discharge. However, river discharge is dynamic and to understand how such dynamics influence ecological patterns, such model outputs must be combined with seasonal to yearly hydrographs in a GIS to forecast temporally and spatially explicit changes in hydrological connectivity. Furthermore, hydrological measures need to translate into ecologically meaningful measures in order to extend forecasting to ecological attributes (Figure 2 and Figure 3).
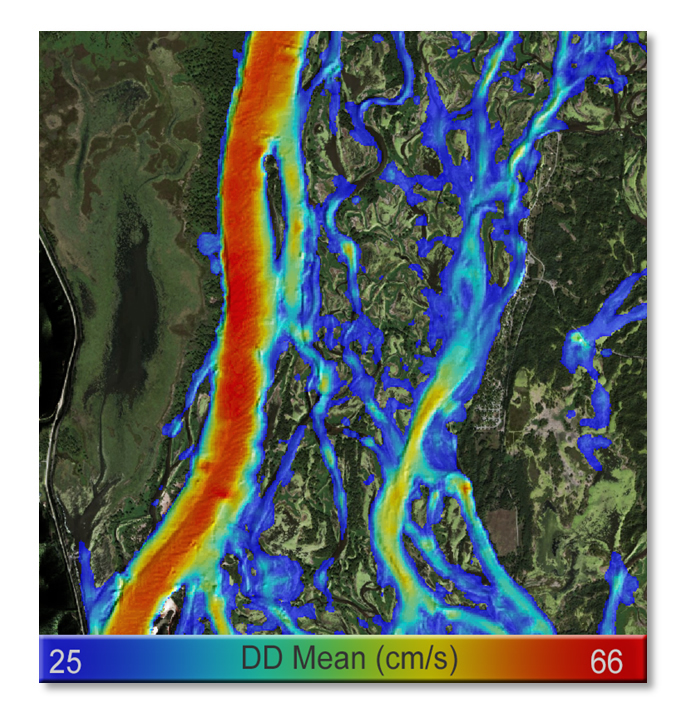
Figure 2. This is an example of the mean water velocity product. This particular product is for the date range of 4/1/2012 - 11/30/2012, constrained to where the water velocity was greater than 25cm/s.
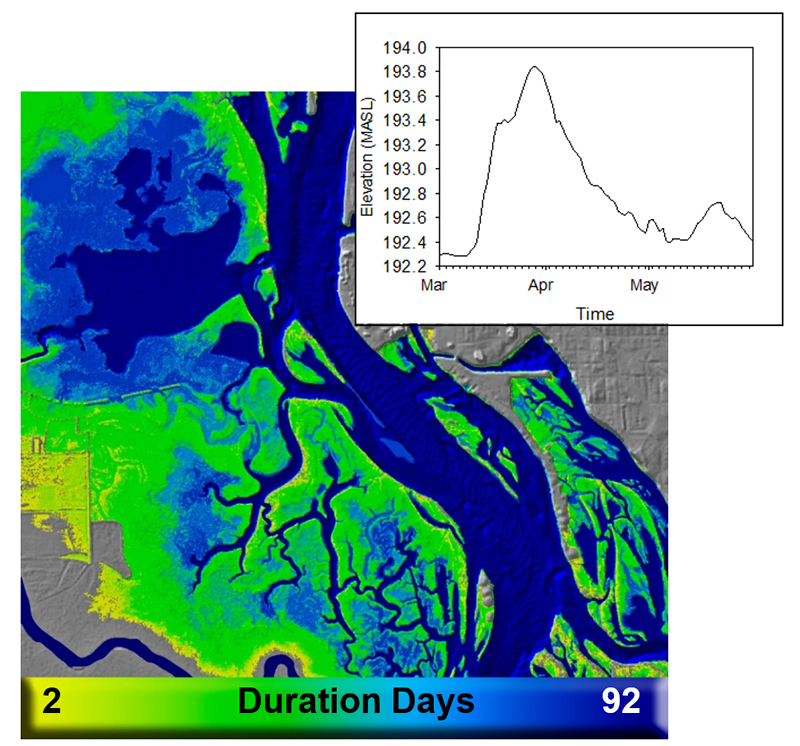
Figure 3. This is an example of the duration days of main channel connectivity and its corresponding hydrograph. This particular product is for the date range of 3/1/2010 - 5/31/2010.
