Upper Midwest Environmental Sciences Center
Long Term Resource Monitoring (LTRMP) Treemap Application Help Page
Understanding the LTMRP Treemap:
Introduction
 Treemaps are a type of chart that allows large amounts of data to be displayed in a space constrained view. Squarified treemaps take data and convert it into rectangles and then displays them in a hiearchal representation on the screen. The rectangles can display various facets of the data depending on the area of the rectangle and also by the color the rectangle. This allows for an overall view of a dataset without having to create multiple charts and helps show status and trend in one chart.
|
Size of Squares
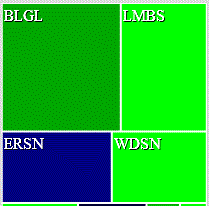 The treemap application takes data and displays it in a series of rectangles making it easy to compare data elements based on the size of the rectangle. The size of the rectangle is based upon the metric that is chosen for the dataset that is selected. For example if you are looking at catch per unit of effort data, the data elements that have a larger catch per unit of effort will have a larger rectangle.
|
Color of Squares
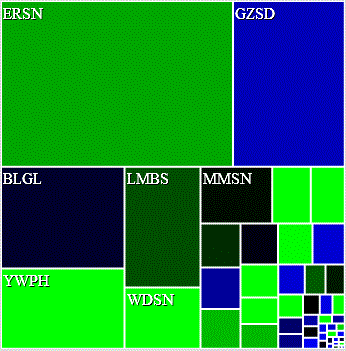 The colors of the rectangles in the treemap application represent how did the individual data item's value did in the query's year compared to how it has done historically. It does this by assigning two colors one color for data elements that are above their normal historical values and a color for elements that are below their normal historical values. The brighter the color either way the higher or lower the data element did compared to it's historical values as values approach their normal values the color will be darker approaching black.
In the example to the right green signifies data elements where the query's year value is historically higher than normal and blue for the elements value is historically lower than normal. The actual process of assigning colors is based off an equation that assigns a value of 0 to 100 where 0 to 49 is for elements that have lower values as compared to historical data and 51 to 100 for elements that have values higher than historical values. The actual equation used to calculate the 0 to 100 ratio is as follows:
- Step 1: If the current value for a data element is greater than or equal to the 90th percentile assign a value of 100 for the ratio
- Step 2: If the current value for a data element is less than or equal to the 10th percentile assign a value of 0 to the ratio
- Step 3: For values falling between the 90th and 10th percentiles the ratio is calculated using the below formula
((current value - 10th percentile)/(90th percentile - 10th percentile)) * 100
Note: The percentiles used in the calculation depend on the query parameter you used to compare the data by. If you selected to compare the data to the Upper Mississippi then the percentiles are calculated for each data element's historical values in all of the six LTRMP sampling pools over all the sampling years. If you selected to compare the data to local pool data then the percentiles are calculated for a data element's historical values in each individual pool over all sampling years.
|
Querying the Data:
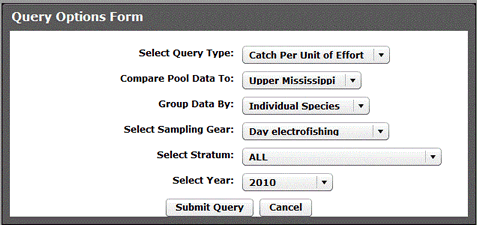 When the LTRMP treemap application first loads, a window with a query data form pops up. To query the database the six query parameters on the form must be filled out and the query submitted. Once the query is submitted the data will be loaded for the parameters selected into the treemap application. If you want to submit a new query, the query options form can be accessed by selecting "New Query" from the "Query Options" menu within the treemap application.
- Query Parameters:
- Query Type
- The query type parameter is used to determine which metric the user would like to see in the dataset. The query type metric is the values used to determine the size of the rectangles.
- Compare Pool Data To
- Compare pool data to is the parameter that is used to determine the color the rectangles in the treemap application will be. There are two options for this parameter, the first comparing data to the entire Upper Mississippi which includes all data from the six LTRMP field stations. The second option is to compare data to local pool data only, so values are only compared to historical values within the each specific LTRMP field station.
- Group Data By
- The group data by parameter allows a user to break the data down by more than just LTRMP pool to show other possible trends and status in the LTRMP fisheries dataset.
- Sampling Gear
- The sampling gear parameter determines which LTRMP fisheries sampling gear is used for the dataset. Different sampling gears can sometimes result in different species being caught and at different rates.
- Stratum
- The stratum parameter allows you to select certain areas of the river or the whole river. If all stratums are selected the calculations are weighted depending on percentage of area of the individual stratums within the specific field station.
- Year
- The year parameter allows the user to select which year of the LTRMP fisheries dataset they want to see within the treemap application.
|
Zooming Into and Out of the Data:
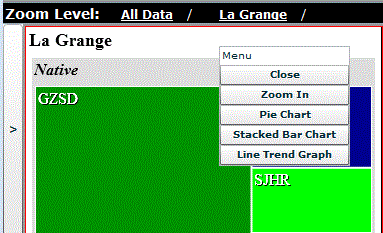 The treemap application allows for a user to zoom deeper into the current dataset to look at individual field stations data or groupings within the field station, depending on the current query. To zoom in to a dataset a user has a couple of different options, the first option is double clicking on any rectangle within the treemap application. The second option for zooming in, is to click on any rectangle in the application and a floating menu will appear with a couple of options with one of them being "Zoom In", select this option and the application will zoom to that rectangle. To zoom out once zoomed in a user has to click on the appropriate zoom level they want to go back to from the links in the "Zoom Level" menu bar.
|
Viewing Other Charts:
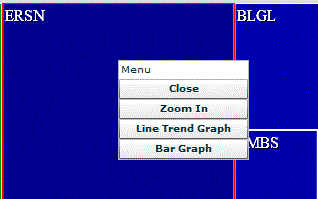 The treemap application along with displaying the dataset queried allows users to view various trend and status graphs about individual data items. Depending on the data item selected different graphs might be available. To view and graph click on a data item and a floating window will pop up with some options including some various graphing options.
|
Viewing Data in Table Form:
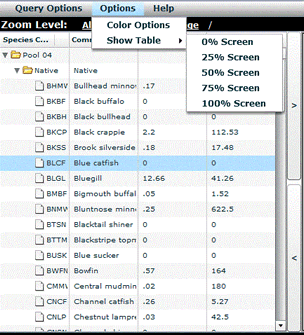 The treemap application allows a user to view the queried data in table form if the user desires to view it that way. To view a table of the data there are two options, the first option is to select the "Options" menu item and then selecting what percentage of the application the table should take up. The second option is to click on one of the two buttons with arrows on them which will either increase the size of the table or reduce the size of the table depending on the button clicked. The table itself can be sorted ascending and descending by clicking on the column headers. By clicking on an item in the data table the data item will be highlighted with a different colored border in the treemap chart.
|
Changing Colors in the Treemap:
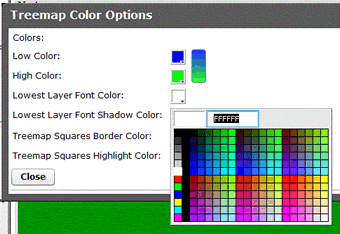 In the treemap application the default colors might be hard for everyone to be able to decipher so there is a color options form where the colors of the application can be changed. To access the color options form click on the "Options" menu and then select "Color Options" a pop up window will appear with all the colors in the application that can be changed. To change a color click on the box next to the appropriate label and a color picker will pop up, from the color picker choose the desired color.
|
Map of LTRMP Pools:
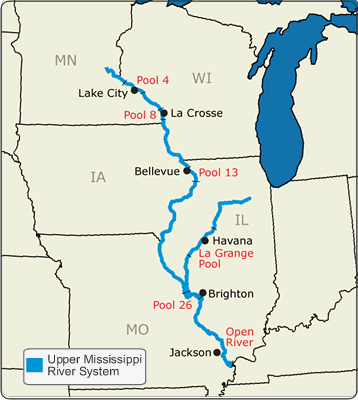 Map of the six LTRMP sampling pools that are displayed within the treemap application.
|
Questions or Problems:
If you have any questions or problems concerning the LTRMP treemap application feel free to contact Benjamin Schlifer (LTRMP database application developer) at
bschlifer@usgs.gov.

 Treemaps are a type of chart that allows large amounts of data to be displayed in a space constrained view. Squarified treemaps take data and convert it into rectangles and then displays them in a hiearchal representation on the screen. The rectangles can display various facets of the data depending on the area of the rectangle and also by the color the rectangle. This allows for an overall view of a dataset without having to create multiple charts and helps show status and trend in one chart.
 The treemap application takes data and displays it in a series of rectangles making it easy to compare data elements based on the size of the rectangle. The size of the rectangle is based upon the metric that is chosen for the dataset that is selected. For example if you are looking at catch per unit of effort data, the data elements that have a larger catch per unit of effort will have a larger rectangle.
 The colors of the rectangles in the treemap application represent how did the individual data item's value did in the query's year compared to how it has done historically. It does this by assigning two colors one color for data elements that are above their normal historical values and a color for elements that are below their normal historical values. The brighter the color either way the higher or lower the data element did compared to it's historical values as values approach their normal values the color will be darker approaching black.
In the example to the right green signifies data elements where the query's year value is historically higher than normal and blue for the elements value is historically lower than normal. The actual process of assigning colors is based off an equation that assigns a value of 0 to 100 where 0 to 49 is for elements that have lower values as compared to historical data and 51 to 100 for elements that have values higher than historical values. The actual equation used to calculate the 0 to 100 ratio is as follows:
  When the LTRMP treemap application first loads, a window with a query data form pops up. To query the database the six query parameters on the form must be filled out and the query submitted. Once the query is submitted the data will be loaded for the parameters selected into the treemap application. If you want to submit a new query, the query options form can be accessed by selecting "New Query" from the "Query Options" menu within the treemap application.
 The treemap application allows for a user to zoom deeper into the current dataset to look at individual field stations data or groupings within the field station, depending on the current query. To zoom in to a dataset a user has a couple of different options, the first option is double clicking on any rectangle within the treemap application. The second option for zooming in, is to click on any rectangle in the application and a floating menu will appear with a couple of options with one of them being "Zoom In", select this option and the application will zoom to that rectangle. To zoom out once zoomed in a user has to click on the appropriate zoom level they want to go back to from the links in the "Zoom Level" menu bar.
 The treemap application along with displaying the dataset queried allows users to view various trend and status graphs about individual data items. Depending on the data item selected different graphs might be available. To view and graph click on a data item and a floating window will pop up with some options including some various graphing options.
 The treemap application allows a user to view the queried data in table form if the user desires to view it that way. To view a table of the data there are two options, the first option is to select the "Options" menu item and then selecting what percentage of the application the table should take up. The second option is to click on one of the two buttons with arrows on them which will either increase the size of the table or reduce the size of the table depending on the button clicked. The table itself can be sorted ascending and descending by clicking on the column headers. By clicking on an item in the data table the data item will be highlighted with a different colored border in the treemap chart.
 In the treemap application the default colors might be hard for everyone to be able to decipher so there is a color options form where the colors of the application can be changed. To access the color options form click on the "Options" menu and then select "Color Options" a pop up window will appear with all the colors in the application that can be changed. To change a color click on the box next to the appropriate label and a color picker will pop up, from the color picker choose the desired color.
 Map of the six LTRMP sampling pools that are displayed within the treemap application.


